
Adding CloudWatch Monitoring to My AWS Auto Scaling Setup
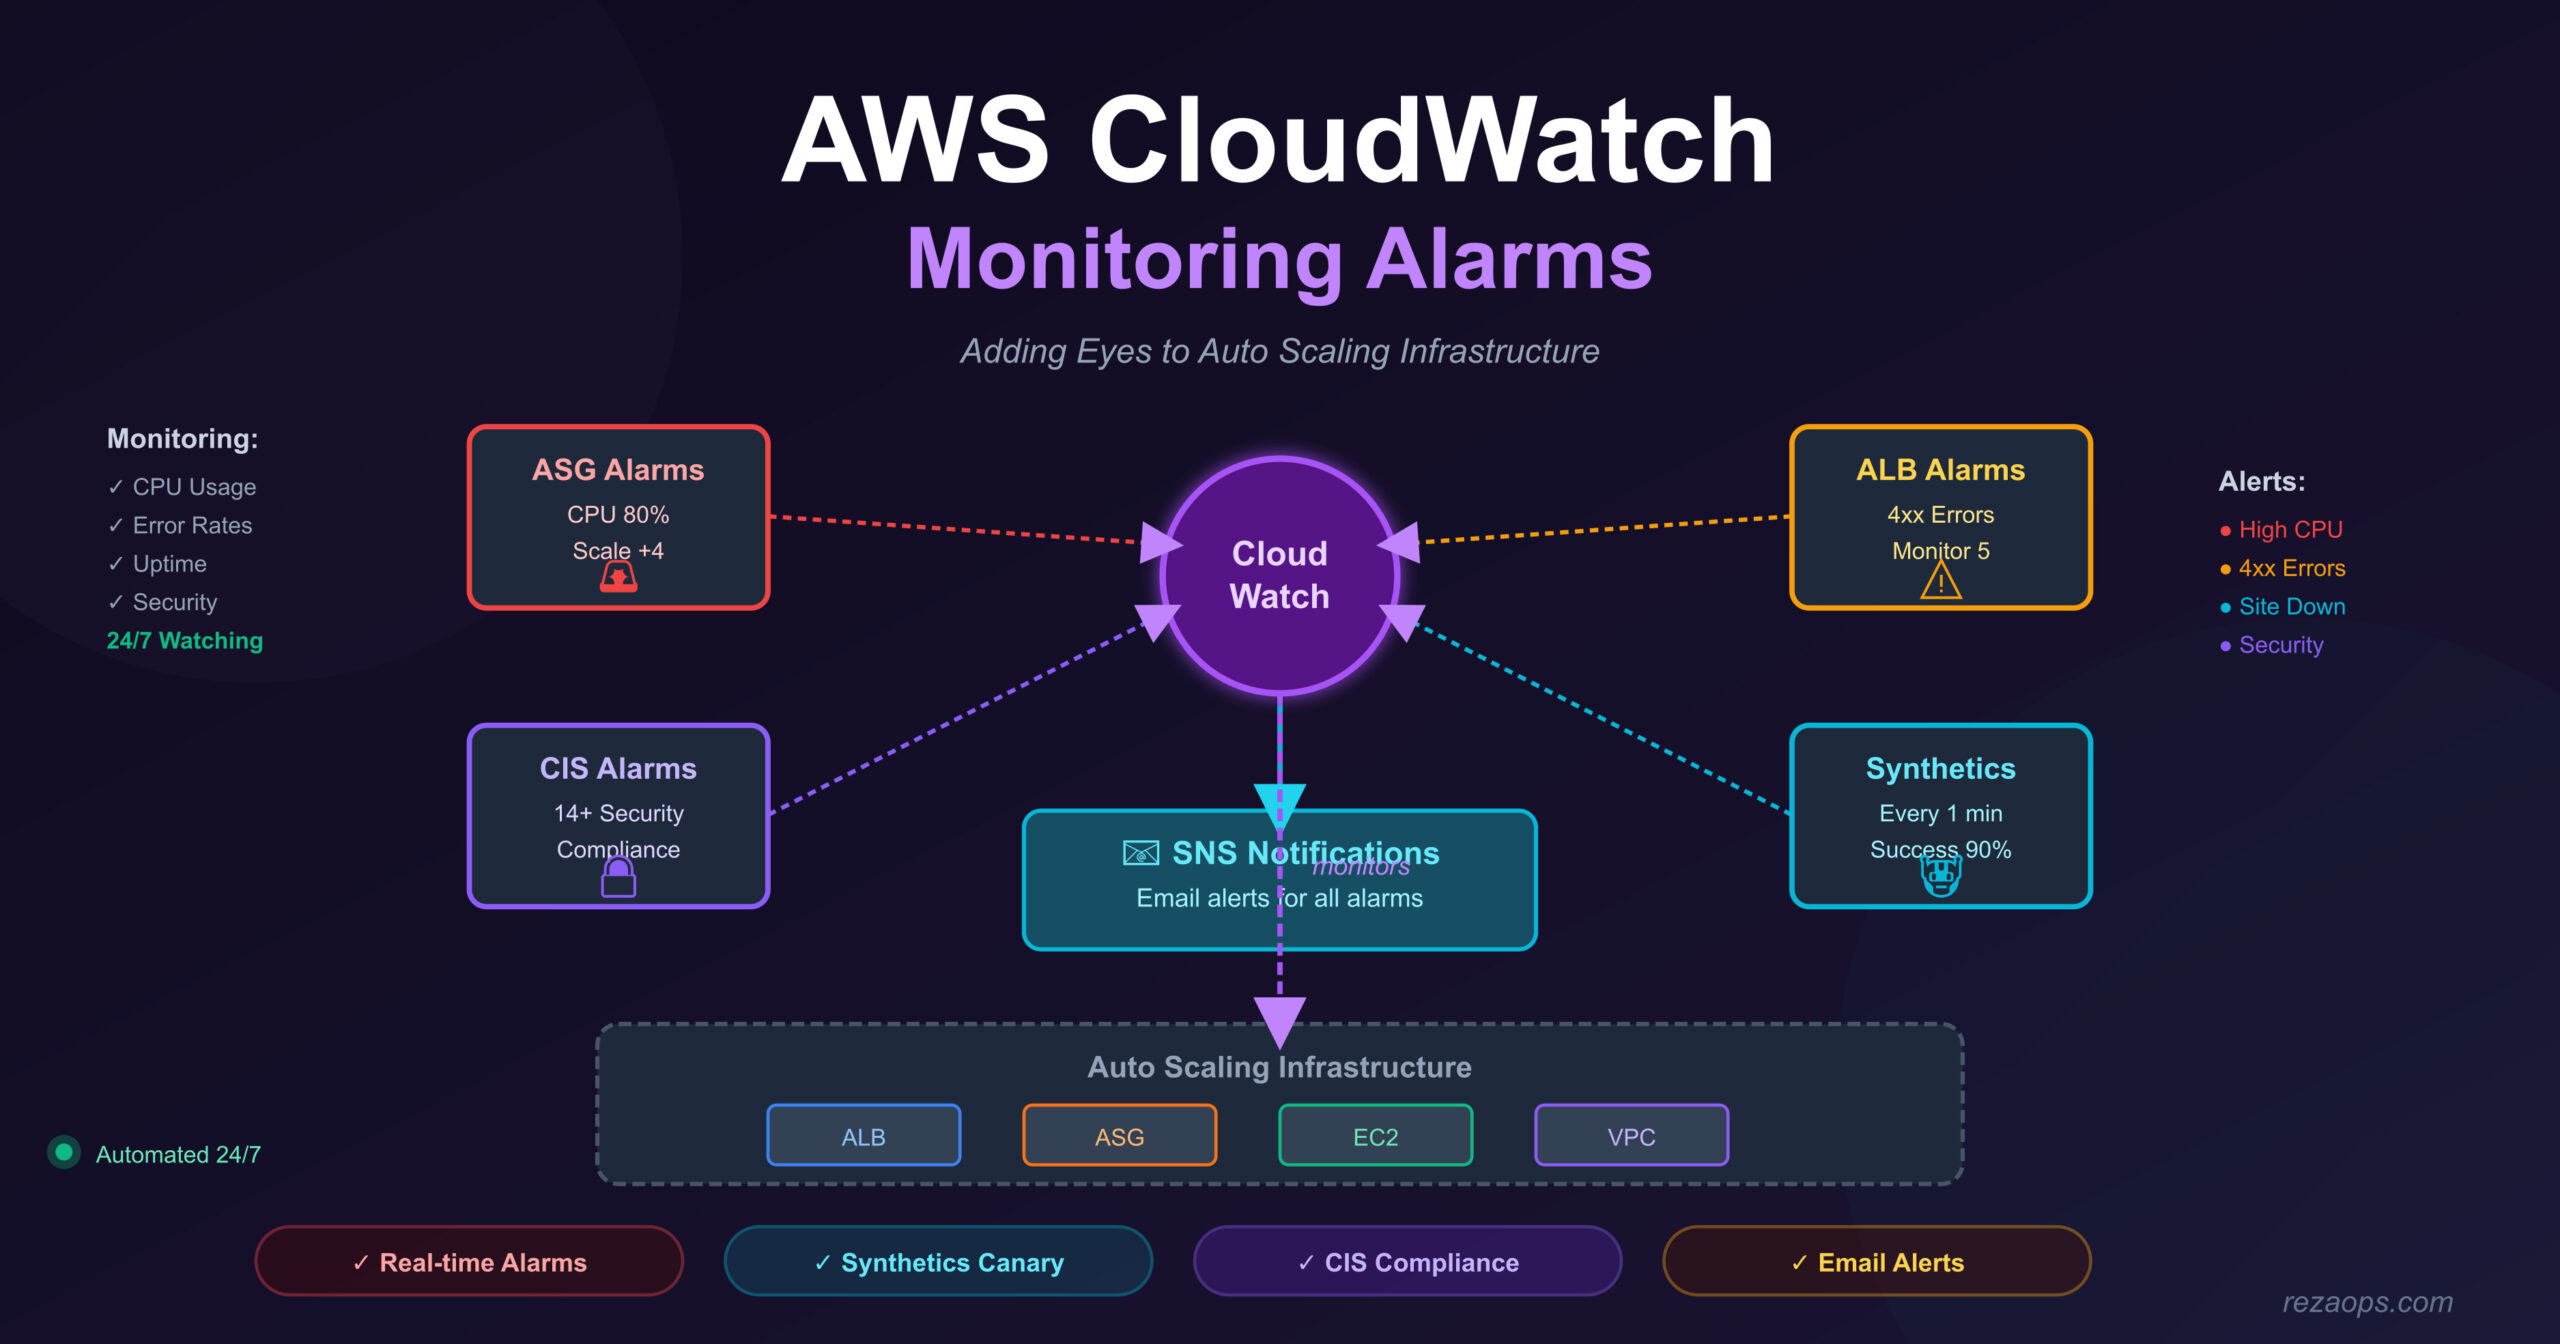
This week, I learned about AWS CloudWatch monitoring. I took my Auto Scaling project and added monitoring to it. Now I can see what’s happening with my infrastructure and get alerts when something goes wrong.
In my previous project, I had Auto Scaling working, but I couldn’t really “see” what was happening. Was my CPU high? Was my website down? I had to check manually. Now with CloudWatch, I get automatic notifications!
What’s the Same and What’s Different?
What stayed the same from Auto Scaling project:
- VPC configuration (same networks)
- Application Load Balancer (same setup)
- Auto Scaling Group with Launch Template
- Target Tracking policies (CPU and request count)
- Scheduled scaling (7 AM and 5 PM)
- SNS notifications for scaling events
- All the same 13 files (c1 through c13)
What’s new in CloudWatch project:
- CloudWatch Alarms – Get alerts when things go wrong
- Synthetics Canary – Robot that checks if my website is up
- CIS Compliance Alarms – Security monitoring
- Simple Scaling Policy – Another way to scale
- Only 4 new files added (c14-01 through c14-05)
Important: The CloudWatch project is just the Auto Scaling project + monitoring. Everything from Auto Scaling is still there, I just added more tools to watch it!
Why I Needed CloudWatch
In my Auto Scaling project, I had these questions:
- Is my website actually working?
- When did my CPU go high?
- How many 4xx errors am I getting?
- Did someone try to access my AWS account from a strange place?
Without CloudWatch, I had to:
- Log into AWS Console
- Check each metric manually
- Look at graphs
- Hope I notice problems
With CloudWatch, AWS watches for me and sends me emails automatically!
The Four New Monitoring Components
Let me explain each new file I created.
1. ASG CPU Alarm with Simple Scaling (c14-02)
This is different from the Target Tracking policy I already had. Let me explain the difference.
What I already had (Target Tracking):
hcl
# From c13-06-autoscaling-ttsp.tf
resource "aws_autoscaling_policy" "avg_cpu_policy_greater_than_xx" {
  name = "avg-cpu-policy-greater-than-xx"
  policy_type = "TargetTrackingScaling"
  target_tracking_configuration {
    predefined_metric_specification {
      predefined_metric_type = "ASGAverageCPUUtilization"
    }
    target_value = 50.0
  }
}
What I added (Simple Scaling):
hcl
# From c14-02-cloudwatch-asg-alarms.tf
resource "aws_autoscaling_policy" "high_cpu" {
  name = "high-cpu"
  scaling_adjustment = 4
  adjustment_type = "ChangeInCapacity"
  cooldown = 300
  autoscaling_group_name = aws_autoscaling_group.my_asg.name
}

resource "aws_cloudwatch_metric_alarm" "app1_asg_cwa_cpu" {
  alarm_name = "App1-ASG-CWA-CPUUtilization"
  comparison_operator = "GreaterThanOrEqualToThreshold"
  evaluation_periods = "2"
  metric_name = "CPUUtilization"
  namespace = "AWS/EC2"
  period = "120"
  statistic = "Average"
  threshold = "80"

  dimensions = {
    AutoScalingGroupName = aws_autoscaling_group.my_asg.name
  }

  alarm_description = "This metric monitors ec2 cpu utilization and triggers the ASG Scaling policy to scale-out if CPU is above 80%"

  ok_actions = [aws_sns_topic.myasg_sns_topic.arn]
  alarm_actions = [
    aws_autoscaling_policy.high_cpu.arn,
    aws_sns_topic.myasg_sns_topic.arn
  ]
}
The difference:
FeatureTarget Tracking (50%)Simple Scaling (80%)When it triggersCPU goes above/below 50%CPU goes above 80%How much it scalesAWS decides automaticallyI decide: Add 4 instancesCooldownAWS managesI set: 300 secondsPurposeNormal operationsEmergency situations
Why have both?
- Target Tracking at 50% = gentle, smooth scaling for normal traffic
- Simple Scaling at 80% = fast emergency response for sudden spikes
Example scenario:
- Normal day: CPU at 40% → No action
- Traffic increases: CPU at 55% → Target Tracking slowly adds 1 instance
- Sudden spike: CPU jumps to 85% → Simple Scaling adds 4 instances immediately!
- I get email: “High CPU alarm triggered!”
Important parts explained:
- evaluation_periods = “2”: Check 2 times before triggering
- period = “120”: Each check is 2 minutes
- threshold = “80”: Trigger when CPU > 80%
- scaling_adjustment = 4: Add 4 instances when alarm triggers
- cooldown = 300: Wait 5 minutes before scaling again
- ok_actions: Send email when alarm returns to OK
- alarm_actions: Scale out AND send email when alarm triggers
2. ALB 4xx Error Monitoring (c14-03)
This alarm watches my Application Load Balancer for client errors.
hcl
resource "aws_cloudwatch_metric_alarm" "alb_4xx_errors" {
  alarm_name = "App1-ALB-HTTP-4xx-errors"
  comparison_operator = "GreaterThanThreshold"
  datapoints_to_alarm = "2"
  evaluation_periods = "3"
  metric_name = "HTTPCode_Target_4XX_Count"
  namespace = "AWS/ApplicationELB"
  period = "120"
  statistic = "Sum"
  threshold = "5"
  treat_missing_data = "missing"

  dimensions = {
    LoadBalancer = module.alb.arn_suffix
  }

  alarm_description = "This metric monitors ALB HTTP 4xx errors and if they are above 100 in specified interval, it is going to send a notification email"

  ok_actions = [aws_sns_topic.myasg_sns_topic.arn]
  alarm_actions = [aws_sns_topic.myasg_sns_topic.arn]
}
```

What this monitors:
- 4xx errors = Client side errors
  - 400 Bad Request
  - 403 Forbidden
  - 404 Not Found
  - etc.

How the alarm works:
- evaluation_periods = "3": Look at last 3 periods (6 minutes total)
- datapoints_to_alarm = "2": Must exceed threshold in 2 out of 3 periods
- threshold = "5": More than 5 errors in 2 minutes

Example scenario:
```
Time 0-2 min: 3 errors → OK
Time 2-4 min: 7 errors → Above threshold (1/3)
Time 4-6 min: 8 errors → Above threshold (2/3)
Result: Alarm triggers! Send email!
Why this is useful:
- If users are getting lots of 404 errors, maybe I have broken links
- If getting lots of 403 errors, maybe my security settings are wrong
- I set threshold to 5 for learning, but in production I’d use 100 or 200
Note: The code says “above 100” in the description but threshold is “5”. This is from the demo – I should update the description to match.
Other metrics I can monitor (mentioned in comments):
hcl
Per ALB Metrics
- HTTPCode_ELB_5XX_Count  (server errors)
- HTTPCode_ELB_502_Count  (bad gateway)
- TargetResponseTime      (how fast instances respond)

Per Target Group Metrics
- UnHealthyHostCount      (failing instances)
- HealthyHostCount        (working instances)
- HTTPCode_Target_4XX_Count  (what I'm using)
- TargetResponseTime      (response time per target)
3. CIS Compliance Alarms (c14-04)
CIS stands for “Center for Internet Security”. They publish security best practices. This module creates many alarms to check if someone is doing suspicious things in my AWS account.
hcl
resource "aws_cloudwatch_log_group" "cis_log_group" {
  name = "cis-log-group-${random_pet.this.id}"
}

module "all_cis_alarms" {
  source = "terraform-aws-modules/cloudwatch/aws//modules/cis-alarms"
  version = "5.6.0"

  disabled_controls = ["DisableOrDeleteCMK", "VPCChanges"]

  log_group_name = aws_cloudwatch_log_group.cis_log_group.name
  alarm_actions = [aws_sns_topic.myasg_sns_topic.arn]
  tags = local.common_tags
}
What this module creates: The CIS alarms module creates about 14-15 different alarms automatically! I don’t have to write each one. Here are some examples:
- UnauthorizedAPICalls – Someone tried to use AWS APIs without permission
- ConsoleSignInWithoutMFA – Someone logged in without two-factor authentication
- RootAccountUsage – Someone used the root account (bad practice!)
- IAMPolicyChanges – Someone changed security permissions
- CloudTrailChanges – Someone tried to disable logging
- ConsoleAuthenticationFailure – Multiple failed login attempts
- S3BucketPolicyChanges – Someone changed S3 bucket permissions
- NetworkACLChanges – Someone changed network rules
- SecurityGroupChanges – Someone changed firewall rules
- RouteTableChanges – Someone changed routing
What I disabled:
hcl
disabled_controls = ["DisableOrDeleteCMK", "VPCChanges"]
```

- DisableOrDeleteCMK: I disabled this because I'm not using AWS KMS (encryption keys) in this project
- VPCChanges: I disabled this because during learning, I might change my VPC often

How it works:
1. AWS CloudTrail logs all actions in my account
2. CloudWatch Logs stores these logs
3. CloudWatch Alarms watch for suspicious patterns
4. If something suspicious happens, I get an email

Example alert:
```
Subject: ALARM: "CIS-UnauthorizedAPICalls" in US East (N. Virginia)
Body: Someone made 5 unauthorized API calls from IP 203.0.113.42
Why this is important:
- If someone steals my AWS keys, I get notified
- If someone tries to hack my account, I know immediately
- Meets security compliance requirements
4. CloudWatch Synthetics Canary (c14-05)
This is the most interesting part! A “canary” is like a robot that visits my website every minute to check if it’s working. The name comes from coal mines where they used real canaries to detect dangerous gas.
hcl
# IAM Policy for Canary
resource "aws_iam_policy" "cw_canary_iam_policy" {
  name = "cw-canary-iam-policy"
  path = "/"
  description = "CloudWatch Canary Synthetic IAM Policy"

  policy = jsonencode({
    "Version": "2012-10-17",
    "Statement": [
      {
        "Sid": "VisualEditor0",
        "Effect": "Allow",
        "Action": "cloudwatch:PutMetricData",
        "Resource": "*",
        "Condition": {
          "StringEquals": {
            "cloudwatch:namespace": "CloudWatchSynthetics"
          }
        }
      },
      {
        "Sid": "VisualEditor1",
        "Effect": "Allow",
        "Action": [
          "s3:PutObject",
          "logs:CreateLogStream",
          "s3:ListAllMyBuckets",
          "logs:CreateLogGroup",
          "logs:PutLogEvents",
          "s3:GetBucketLocation",
          "xray:PutTraceSegments"
        ],
        "Resource": "*"
      }
    ]
  })
}

# IAM Role
resource "aws_iam_role" "cw_canary_iam_role" {
  name = "cw-canary-iam-role"
  description = "CloudWatch Synthetics lambda execution role for running canaries"
  path = "/service-role/"
  assume_role_policy = "{\"Version\":\"2012-10-17\",\"Statement\":[{\"Effect\":\"Allow\",\"Principal\":{\"Service\":\"lambda.amazonaws.com\"},\"Action\":\"sts:AssumeRole\"}]}"
  managed_policy_arns = [aws_iam_policy.cw_canary_iam_policy.arn]
}

# S3 Bucket for screenshots and artifacts
resource "aws_s3_bucket" "cw_canary_bucket" {
  bucket = "cw-canary-bucket-${random_pet.this.id}"
  force_destroy = true

  tags = {
    Name = "My bucket"
    Environment = "Dev"
  }
}

resource "aws_s3_bucket_ownership_controls" "example" {
  bucket = aws_s3_bucket.cw_canary_bucket.id
  rule {
    object_ownership = "BucketOwnerPreferred"
  }
}

resource "aws_s3_bucket_acl" "example" {
  depends_on = [aws_s3_bucket_ownership_controls.example]
  bucket = aws_s3_bucket.cw_canary_bucket.id
  acl = "private"
}

# The actual Canary
resource "aws_synthetics_canary" "sswebsite2" {
  name = "sswebsite2"
  artifact_s3_location = "s3://${aws_s3_bucket.cw_canary_bucket.id}/sswebsite2"
  execution_role_arn = aws_iam_role.cw_canary_iam_role.arn
  handler = "sswebsite2.handler"
  zip_file = "sswebsite2/sswebsite2v1.zip"
  runtime_version = "syn-nodejs-puppeteer-6.0"
  start_canary = true

  run_config {
    active_tracing = true
    memory_in_mb = 960
    timeout_in_seconds = 60
  }

  schedule {
    expression = "rate(1 minute)"
  }
}

# Alarm for Canary failures
resource "aws_cloudwatch_metric_alarm" "synthetics_alarm_app1" {
  alarm_name = "Synthetics-Alarm-App1"
  comparison_operator = "LessThanThreshold"
  datapoints_to_alarm = "1"
  evaluation_periods = "1"
  metric_name = "SuccessPercent"
  namespace = "CloudWatchSynthetics"
  period = "300"
  statistic = "Average"
  threshold = "90"
  treat_missing_data = "breaching"

  dimensions = {
    CanaryName = aws_synthetics_canary.sswebsite2.id
  }

  alarm_description = "Synthetics alarm metric: SuccessPercent LessThanThreshold 90"

  ok_actions = [aws_sns_topic.myasg_sns_topic.arn]
  alarm_actions = [aws_sns_topic.myasg_sns_topic.arn]
}
What this does – step by step:
- IAM Role and Policy: Gives the canary permission to:
- Write metrics to CloudWatch
- Save screenshots to S3
- Write logs
- Use AWS X-Ray for tracing
- S3 Bucket: Stores:
- Screenshots when pages load
- Screenshots when pages fail
- HAR files (network activity logs)
- Logs of what the canary did
- The Canary itself:
- name: “sswebsite2” – my canary name
- runtime: Uses Node.js with Puppeteer (headless Chrome browser)
- schedule: Runs every 1 minute
- memory: 960 MB (enough to run a browser)
- timeout: 60 seconds maximum
- zip_file: Contains the JavaScript code that visits my website
- Alarm: Triggers if success rate drops below 90%
The Canary Script (sswebsite2.js):
This file is in sswebsite2/nodejs/node_modules/sswebsite2.js. Let me explain what it does:
javascript
const URL = require('url');
const synthetics = require('Synthetics');
const log = require('SyntheticsLogger');

const loadBlueprint = async function () {
    // The website to check
    const urls = ['https://rezaops.com'];

    const takeScreenshot = true;

    syntheticsConfiguration.disableStepScreenshots();
    syntheticsConfiguration.setConfig({
       continueOnStepFailure: true
    });

    let page = await synthetics.getPage();

    for (const url of urls) {
        await loadUrl(page, url, takeScreenshot);
    }
};

const loadUrl = async function (page, url, takeScreenshot) {
    let stepName = URL.parse(url).hostname;

    await synthetics.executeStep(stepName, async function () {
        const response = await page.goto(url, {
            waitUntil: ['domcontentloaded'],
            timeout: 30000
        });

        if (response) {
            const status = response.status();

            // If status is not 2xx, throw error
            if (response.status() < 200 || response.status() > 299) {
                throw `Failed to load url: ${url} ${response.status()}`;
            }
        } else {
            throw new Error(`No response returned for url: ${url}`);
        }
    });

    // Wait 15 seconds for page to fully load
    if (takeScreenshot) {
        await page.waitFor(15000);
        await synthetics.takeScreenshot(stepName, 'loaded');
    }
};

exports.handler = async () => {
    return await loadBlueprint();
};
What the script does:
- Opens a headless Chrome browser
- Visits
https://stacksimplify.com - Waits for page to load (domcontentloaded event)
- Checks if HTTP status is 200-299 (success)
- Waits 15 seconds for everything to load
- Takes a screenshot
- Saves screenshot to S3
- Reports success/failure to CloudWatch
What I Learned
Technical Lessons
- Target Tracking vs Simple Scaling: Both have their place. Target Tracking for gradual scaling, Simple Scaling for emergencies.
- Alarm evaluation is not instant: If I set evaluation_periods=2 and period=120, it takes 4 minutes minimum to trigger the alarm. This is okay for most things, but for critical alerts I might want faster checking.
- Synthetics are powerful but expensive: Running every minute costs about $52/month. For learning, every 5 minutes is enough.
- CIS alarms are great for security: I get 14-15 security alarms with just one module. This would take hours to set up manually!
- Screenshots are super helpful: When my canary fails, the screenshot shows me exactly what the error page looks like.
- SNS is the bridge: All my alarms send notifications through the same SNS topic. One email subscription gets all alerts.
Practical Tips
- Don’t set thresholds too sensitive: If I set ALB 4xx threshold to 1, I’ll get alarms all day. Start with 5-10 for learning, then adjust.
- Test your alarms: After deploying, I intentionally broke my site to make sure alarms actually trigger and I get emails.
- Organize alarm names well: I prefix with “App1-” so I know which app the alarm is for. In production with multiple apps, this is very important.
- Check alarm history: CloudWatch keeps history of when alarms triggered. This helps me understand patterns.
- S3 costs: Synthetics saves lots of screenshots. After a few days, I should set up S3 lifecycle policy to delete old screenshots automatically.
Mistakes I Made
- Forgot to confirm SNS subscription: Deployed everything, wondered why no emails. Checked spam folder, found confirmation email from 2 days ago!
- Set ALB threshold too low: Set it to 1 error, got 50 emails in first hour. Changed to 5.
- Canary timeout too short: Set timeout to 10 seconds. Page takes 15 seconds to load. Canary always failed! Changed to 60 seconds.
- Wrong URL in canary script: Script checked
stacksimplify.cominstead of my domain. All checks passed but wasn’t actually checking my site! - Didn’t disable VPCChanges CIS alarm: During learning, I change VPC often. Got alarm every time. Disabled it.
- Forgot about S3 costs: Let canary run for a month. S3 bucket had 43,000 screenshots! Changed to delete after 7 days.