$ cat job-board-api/part-14.md
Building a Job Board API, Part 14: Metrics for Prometheus
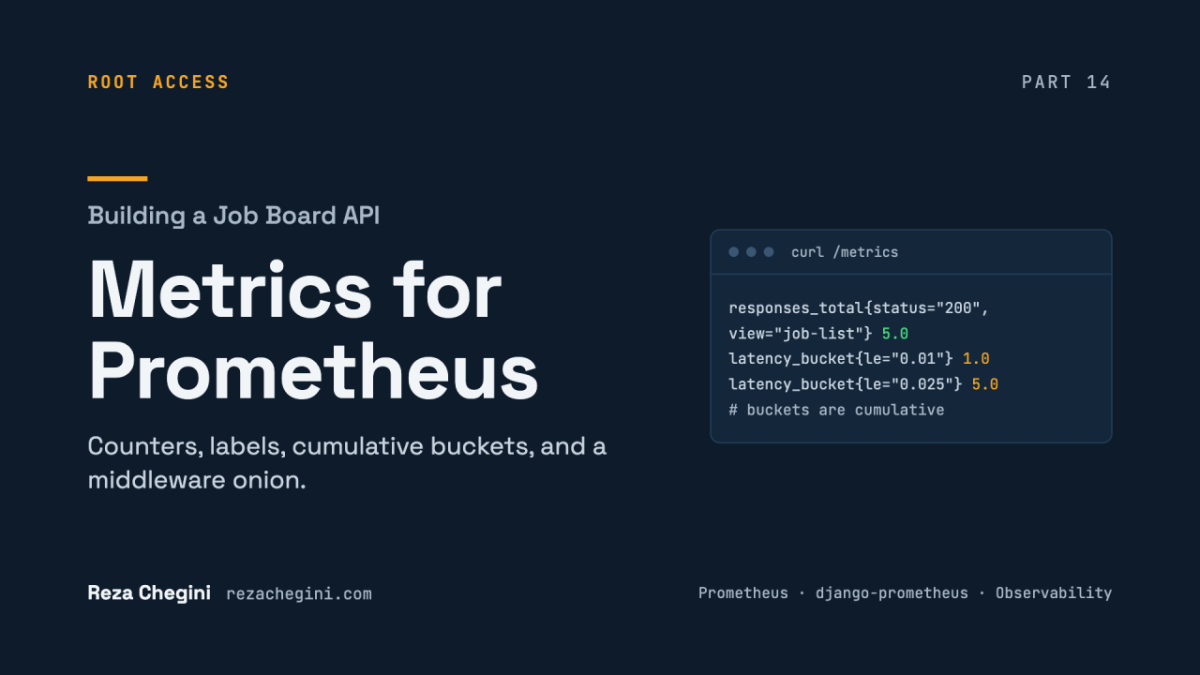
From “OK right now?” to “how has it behaved?”
In Part 13, I added /healthz and /readyz. They answer one question: is the app OK right now? That’s what Kubernetes needs to decide on restarts and traffic.
But an operator needs more than a yes or a no. How many requests per second? What share of them fail? Are they getting slower? Those questions are about behaviour over time, and they need metrics.
This part adds a /metrics endpoint for Prometheus, the monitoring system I already run in my home lab. Prometheus uses a pull model: the app only keeps numbers in memory, and Prometheus comes and scrapes them on a schedule, every 15 seconds for example. The app never needs to know where Prometheus lives. And if a scrape fails, that failure is itself a useful signal.
The surprising part: this step needed no new code of my own. One dependency, three settings, one URL line. So this article is less about writing code, and more about understanding what those few lines produce, and how to read it correctly. Because metrics are very easy to misread.
Step 1: django-prometheus and the middleware onion
uv add "django-prometheus>=2.5"

docker compose up -d --build
>=2.5 because 2.5.0 is the release that added support for Django 5.2, the version I’m on. A new dependency means a rebuild, as always, because packages live inside the image (Part 3).
Then the app goes into INSTALLED_APPS, and two middleware classes go into MIDDLEWARE:
MIDDLEWARE = [

    "django_prometheus.middleware.PrometheusBeforeMiddleware",

    # ... existing middleware, unchanged, same order ...

    "django_prometheus.middleware.PrometheusAfterMiddleware",

]
The position of these two lines is the important part. Django middleware works like an onion: a request passes through the list from top to bottom, and the response passes back from bottom to top.
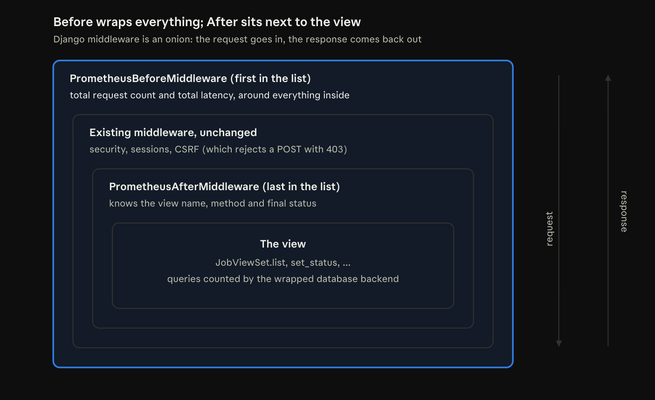
- Before, first in the list, is the first to see the request and the last to see the response. So it measures the total time, around everything else.
- After, last in the list, sits closest to the view. By then, Django knows which view handled the request, the method, and the final status code. That’s where labels like view=”job-list” come from.
If I put Before somewhere in the middle, its timing would miss the outer middleware. And a request that an outer middleware rejected, like the CSRF 403 from Part 13, could be counted wrongly or not at all. Order matters.
Step 2: Database metrics and the URL
A wrapped database backend
"ENGINE": "django_prometheus.db.backends.postgresql",This replaces django.db.backends.postgresql. It’s a thin subclass of Django’s own PostgreSQL backend: the same psycopg driver, the same SQL, the same migrations. It only wraps each query to count it.
That gives me django_db_execute_total and django_db_errors_total. The error counter is the interesting one. A view can catch a database error and still return a normal response, so the HTTP status codes look fine. A rising database error count shows the trouble anyway.
I checked that the swap was really harmless: makemigrations –check found no changes, /readyz said the database was ok, and the worker’s idempotency transaction from Part 12 still worked, because an email was sent.
The URL
path("", include("django_prometheus.urls")), # GET /metricsThe package’s URL file contains one pattern, metrics. Including it at “” makes the full path /metrics, at the top level, next to /healthz.
- No trailing slash, the lesson from Part 13. Prometheus treats a redirect as a failed scrape, unless it’s told to follow redirects.
- No authentication. It’s a plain Django view, not DRF, so the global IsAuthenticated doesn’t apply. That’s the normal Prometheus setup, but it means /metrics must never be reachable from the public internet. More on that in the gaps.
Step 3: Reading the output
GET /metrics returns plain text in the Prometheus exposition format, with the header Content-Type: text/plain; version=1.0.0; charset=utf-8. Here are real lines from this step, and what they mean.
A counter
django_http_responses_total_by_status_view_method_total{method="GET",status="200",view="job-list"} 5.0- A counter ends in _total. It only goes up, and it resets to 0 when the process restarts. So in Prometheus you almost never look at the raw number. You look at its rate, with rate(…[5m]), which also handles the resets.
- The part in {…} is the labels. Every unique combination of labels is a separate time series.
Labels and cardinality
Look at view=”job-list”. That’s the URL name from DRF’s router, not the raw path. So /api/jobs/1/ and /api/jobs/2/ both count under one series, job-detail.
This matters a lot. If the label were the raw path, every job ID would create a new time series. A million jobs, a million series, and Prometheus slowly runs out of memory. The number of different label values is called cardinality, and keeping it low is one of the first rules of metrics.
Errors
django_http_responses_total_by_status_view_method_total{method="GET",status="404",view="job-detail"} 1.0Errors carry their status code. So “what share of responses are 5xx?” becomes a single PromQL query later. That’s the basis of an availability SLO.
A histogram, and its trap
django_http_requests_latency_seconds_by_view_method_bucket{le="0.01",method="GET",view="job-list"} 1.0

django_http_requests_latency_seconds_by_view_method_bucket{le="0.025",method="GET",view="job-list"} 5.0
A histogram counts how long requests took, in buckets. le means “less than or equal”. And here is the trap: buckets are cumulative. Each request is counted in every bucket it fits under.
So these two lines do not mean “1 request took up to 10 ms, and 5 more took between 10 and 25 ms”. They mean: 1 request took 10 ms or less, and all 5 took 25 ms or less, including that first one. Reading them the other way gives you 6 requests that never happened.
A histogram also has _count (the number of requests) and _sum (the total seconds), so the average is _sum / _count. And histogram_quantile(0.95, …) estimates the p95 latency from the buckets. It’s an estimate, only as precise as the bucket edges.
The database
django_db_execute_total{alias="default",vendor="postgresql"} 30.0All queries since the process started. That includes the queries for authentication, like the JWT user lookup from Part 3, so it’s a total for the process, not per view.
A series appears only when it first happens
One thing that confused me at first: before my first GET /api/jobs/, there was no view=”job-list” line at all. Not a line with 0. No line. A labelled series is created the first time its event happens. So an empty grep means “zero so far”, not “broken”.
Step 4: Testing it
No mocks this time. Real requests, then read the real counters.
- GET /metrics with no token: 200, the Prometheus content type, and 182 lines starting with django_.
- The before/after pair. Before: no job-list line at all. Then I sent GET /api/jobs/ 5 times. After: status=”200″ … 5.0. Exactly the number of requests I sent.
- A 404: GET /api/jobs/99999/ added status=”404″,view=”job-detail” 1.0.
- Latency buckets: le=”0.01″ was 1, and every bucket from le=”0.025″ up was 5. All requests finished in 25 ms or less.
- Database: django_db_execute_total was 30, and there was no error line at all.
- Nothing else broke: /readyz said ready, and a real status change still produced Emailed user 5 about application 3: reviewing -> interview.
- The PATCH counter showed view=”application-set-status” with a count of 2: both PATCH requests that reached Django were counted.
Why a before/after pair? A single reading of 5.0 could come from anywhere: an earlier test, a probe, a reload. Seeing no line before and exactly 5 after proves the counter was caused by my traffic. It’s the same “compare two states” habit that found my cache bug in Part 9.
Problems I hit: the test was wrong, three times
There were no bugs in the code this time. All three problems were in my tests. And each one was solved by the same question: did the request even reach Django?
1. Every check returned 000
After docker compose up -d –build, every curl returned 000, with curl exit=56, and my token helper failed with JSONDecodeError.
I first ruled out a crash. The API log showed System check identified no issues and Starting development server, but no request lines at all. runserver logs every request it handles. So none of my requests had reached Django.
The cause: docker compose up -d returns before the app is listening. docker compose ps said Up Less than a second. The app needed about 10 seconds to start. During that time, Docker’s port forwarder accepted my connection on port 8006 and then dropped it, because nothing inside the container was listening yet. That’s exit code 56, “failure receiving data”, not “connection refused”.
The fix: after every up -d or restart, wait for a real endpoint:
for i in $(seq 30); do curl -s -o /dev/null http://localhost:8006/healthz && { echo "api up after ${i}s"; break; }; sleep 1; doneA started container is not a ready app. In Kubernetes, the readiness probe from Part 13 solves exactly this problem.
This also explains the PATCH count of 2: a third PATCH I sent during startup got 000. It never reached Django, so it was never counted. The metrics were right.
2. No email after a 200
A status change returned 200, but the worker logged no email. My first worry was a lost message. I checked: the worker was up and idle, the queue and DLQ were both 0 / 0, and there were no errors.
The cause was my assumption. The application was already “reviewing”, because the last status change from Part 13 had been processed. My PATCH set “reviewing” to “reviewing”. No change, so no event, so no email. That’s the “only on a real change” rule from Part 10 working exactly as designed. A real change to “interview” produced the email.
3. A missing header
I used head -n 3 to look for the Content-Type header and didn’t find it. The Date and Server headers come first. grep -i “^content-type” found it.
Known gaps
This step works, but I want to be honest about what it doesn’t cover yet:
- /metrics has no login. Anyone who can reach it can read it. It must never be public. In Kubernetes, the Ingress will only route /api/, and Prometheus will scrape the pod from inside the cluster.
- Many processes split the counters. Right now one runserver process holds all the numbers. With several gunicorn workers, each process has its own counters, and each scrape would hit a random one. The fix is prometheus_client multiprocess mode (with PROMETHEUS_MULTIPROC_DIR) or one metrics port per process. That comes with the gunicorn step.
- Probe traffic is counted too. Kubernetes will call /healthz and /readyz every few seconds, and those requests land in the same counters. In dashboards I will filter them out using the view label.
- ALLOWED_HOSTS and the pod IP. Prometheus scrapes the pod by its IP, and Django rejects hosts it doesn’t know. It’s the same fix I needed in my first project.
- The worker has no metrics yet. It isn’t a web server, so it needs its own small metrics server (start_http_server) later.
- The cache isn’t measured. The database is wrapped, but the Redis cache backend isn’t, so there are no cache hit/miss numbers yet.
What I learned
- Metrics answer “how much” and “how often”; logs answer “what exactly happened”. You need both, but metrics are what you alert on.
- Middleware is an onion. The “before” middleware must be first and the “after” middleware must be last, or some requests are never counted or never timed.
- Labels are powerful but dangerous. A label like view has a few values. A label like a user ID or a full URL could create millions of time series and break Prometheus.
- Histogram buckets are cumulative. le=”0.025″ includes everything in le=”0.01″. Once I understood that, the numbers made sense.
- Prometheus pulls. The app doesn’t send anything. It just keeps numbers in memory and shows them when asked.
- Before you trust a test result, ask if the request even reached the app. All three of my problems this time were in the test, not the code.
What comes next
The next step is structured JSON logs. Every log line becomes a JSON object that a log system can search. It should also fix the missing INFO logs from the worker that I noticed in Part 10.
After that: configuration from environment variables only, and a multi-stage Dockerfile with gunicorn instead of runserver. Phase 4 is done when the container runs with only environment variables and exposes health and metrics.
And later, in my next project, I will connect a real Prometheus and Grafana to these metrics and write my first SLOs on top of them.