$ cat job-board-api/part-15.md
Building a Job Board API, Part 15: Structured JSON Logs
I’m sharing one of my projects here from the beginning, step by step. It’s a Job Board API built with Django, Django REST Framework, PostgreSQL and Docker Compose, with S3 and SQS (through LocalStack), Redis, and a background worker.
I’m a junior engineer looking for my first role in DevOps, SRE or Cloud. That’s why I build projects like this and write about them in public. It shows how I think, and writing it down helps me really understand it.
In Part 13 I added health checks. In Part 14 I added metrics for Prometheus. This is the third piece of observability: logs.
Why plain-text logs are not enough
Before this step, my logs looked like this:
2026-11-06 00:41:06,148 INFO worker Worker started, ...A person can read that. A log system can’t, at least not easily. To find “every log line for application 3”, it has to guess where the number is inside the sentence.
There was a second, bigger problem. The API’s INFO lines were invisible. Since Phase 3, the API logged Queued … every time it sent a message to the queue, but I never saw those lines. I only saw warnings. I noticed this in Part 10 and finally found the reason in this step.
After this step, every log line from the API and the worker is one JSON object on stdout:
{"level": "INFO", "logger": "jobs.events", "message": "Queued application.status_changed for application 3 (message afc12ed7-...)", "event": "application.status_changed", "event_id": "9c6d422a-...", "application_id": 3, "message_id": "afc12ed7-...", "timestamp": "2026-11-06T01:08:15.303541+00:00"}Each line has:
- Fixed fields: level, logger, message and timestamp (UTC, ISO 8601).
- A whole traceback as one field, exc_info, instead of 40 separate lines.
- Our own facts as real fields: event_id, application_id, message_id and more.
The log level now comes from an environment variable, LOG_LEVEL. And the same event_id appears on the API’s Queued line and on the worker’s Emailed line, so I can follow one status change across two processes.
The dependency
uv add "python-json-logger>=3.1"python-json-logger is the standard JSON formatter for Python’s built-in logging module. I don’t have to change how I call logger.info(…) anywhere. It only changes how each line is written.
Why >=3.1? Version 3.1 moved things around. The formatter now lives in pythonjsonlogger.json, and a list called RESERVED_ATTRS lives in pythonjsonlogger.core. Older versions only have pythonjsonlogger.jsonlogger, so my imports would fail on them.
It’s a new dependency, so the image has to be rebuilt with docker compose up -d –build.
In config/settings.py I import that list:
from pythonjsonlogger.core import RESERVED_ATTRSRESERVED_ATTRS is the list of standard attribute names that every Python log record has: msg, args, levelno, pathname, lineno, process and so on. The formatter never copies these into the JSON as extra fields. I extend this list later, and you’ll see why.
The log level comes from the environment
LOG_LEVEL = env("LOG_LEVEL", "INFO").upper()It’s read once at startup, with INFO as the default.
.upper() means warning works as well as WARNING. I tested it: with -e LOG_LEVEL=warning, the root logger’s level was WARNING.
I use it in two places below, so it’s a variable instead of two env() calls.
Because settings are read once, changing it needs a process restart.
I also added LOG_LEVEL=INFO to .env.example so the variable is documented. My own .env doesn’t need it, because the default applies.
This is part of a bigger goal for Phase 4: the container should run with only environment variables, and no config baked into the image.
The LOGGING setting, piece by piece
Django passes the LOGGING dict to Python’s logging.config.dictConfig while it starts up (django.setup()). That happens in every process: runserver, manage.py shell, and the worker, which calls django.setup() itself. So one setting configures logging everywhere.
Python logging has four parts, and the dict has a section for each:
- Formatters decide how a line looks.
- Handlers decide where a line goes.
- Loggers decide which records are kept, by name and level.
- Root is the catch-all logger at the top.
The start
LOGGING = {
    "version": 1,
    "disable_existing_loggers": False,
“version”: 1 is required. It’s the schema version, and 1 is the only one.
disable_existing_loggers: False is important. The default is True, and it silences every logger that already exists when the config runs. Django’s own loggers, my worker logger and my cloud.health logger would then print nothing at all.
The formatter: what a line looks like
    "formatters": {
        "json": {
            "()": "pythonjsonlogger.json.JsonFormatter",
            "fmt": "%(levelname)s %(name)s %(message)s",
            "rename_fields": {"levelname": "level", "name": "logger"},
            "timestamp": True,
            "reserved_attrs": [*RESERVED_ATTRS, "request"],
        },
    },
A formatter turns a log record into text. Line by line:
- “()” means “call this to build the formatter”. dictConfig imports the class from the dotted path and passes all the other keys as keyword arguments: JsonFormatter(fmt=…, rename_fields=…, timestamp=True, reserved_attrs=…). That’s why the key is fmt, not format: it must match the argument name. Without “()”, dictConfig would build a normal logging.Formatter, and the output wouldn’t be JSON.
- fmt looks like the classic %(…)s format string, but python-json-logger reads it as a list of fields to include: the level, the logger name and the message. message is the final text, with the %s values already filled in.
- rename_fields changes levelname to level and name to logger. They’re shorter and clearer, and they’re the names my Loki queries will use later.
- timestamp: True adds a field like “timestamp”: “2026-11-06T01:08:15.303541+00:00”. It’s in UTC with the offset. That’s better than the classic asctime, which is local time, has no timezone and uses a comma before the milliseconds. With UTC ISO timestamps, logs from machines in different timezones sort correctly as plain text.
- reserved_attrs: [*RESERVED_ATTRS, “request”] needs a longer explanation:
- [*a, “x”] is a new list with everything in a, plus “x”.
- The formatter copies every non-reserved attribute on a record into the JSON. That’s how my own fields appear (next section).
- But runserver attaches the raw network socket to its records as request, and Django’s django.request logger attaches the whole HttpRequest on 4xx and 5xx responses. Neither can be turned into JSON, so the formatter wrote their text form: “<socket.socket fd=4, … laddr=(‘172.18.0.6’, 8006), raddr=(‘172.18.0.1’, 46876)>”. That’s junk, and it puts internal IP addresses on every line.
- Adding request to the reserved list drops it. Useful fields like status_code and server_time are not reserved, so they stay.
The handler: where a line goes
    "handlers": {
        "stdout": {
            "class": "logging.StreamHandler",
            "stream": "ext://sys.stdout",
            "formatter": "json",
        },
    },
ext://sys.stdout is dictConfig’s way to say “this existing Python object”. A StreamHandler writes to stderr by default. I chose stdout so the container has one stream of JSON. Docker and Kubernetes collect both, but one stream is simpler.
No log files. A container writes logs to stdout, and the platform collects them. This is the 12-factor rule: logs are a stream of events. A file inside a container is lost when the container is replaced, and it can fill the disk.
Root: the catch-all
"root": {"handlers": ["stdout"], "level": LOG_LEVEL},Logger names are dotted, like jobs.events or cloud.health, and they form a tree with root at the top. A logger with no handler of its own propagates its records up the tree to root. So worker, jobs.events, jobs.views, cloud.health and jobs.cache all reach root and get the JSON handler.
This one line fixed my invisible INFO logs. Before, the API had no handler on root at all. When Python finds no handler, it uses a fallback called logging.lastResort. That fallback only prints WARNING and above, as plain text. That’s exactly why I saw warnings in Phase 3 but never Queued …. The worker had no such problem only because it had its own basicConfig (more on that soon).
Named loggers: Django and the noisy libraries
    "loggers": {
        "django": {"handlers": ["stdout"], "level": LOG_LEVEL, "propagate": False},
        "django.server": {"handlers": ["stdout"], "level": "INFO", "propagate": False},
        "botocore": {"level": "WARNING"},
        "urllib3": {"level": "WARNING"},
    },
}
django and django.server must be listed. Django applies its own default logging first, and those defaults give both loggers their own plain-text handlers. Listing them here replaces those handlers with my JSON one.
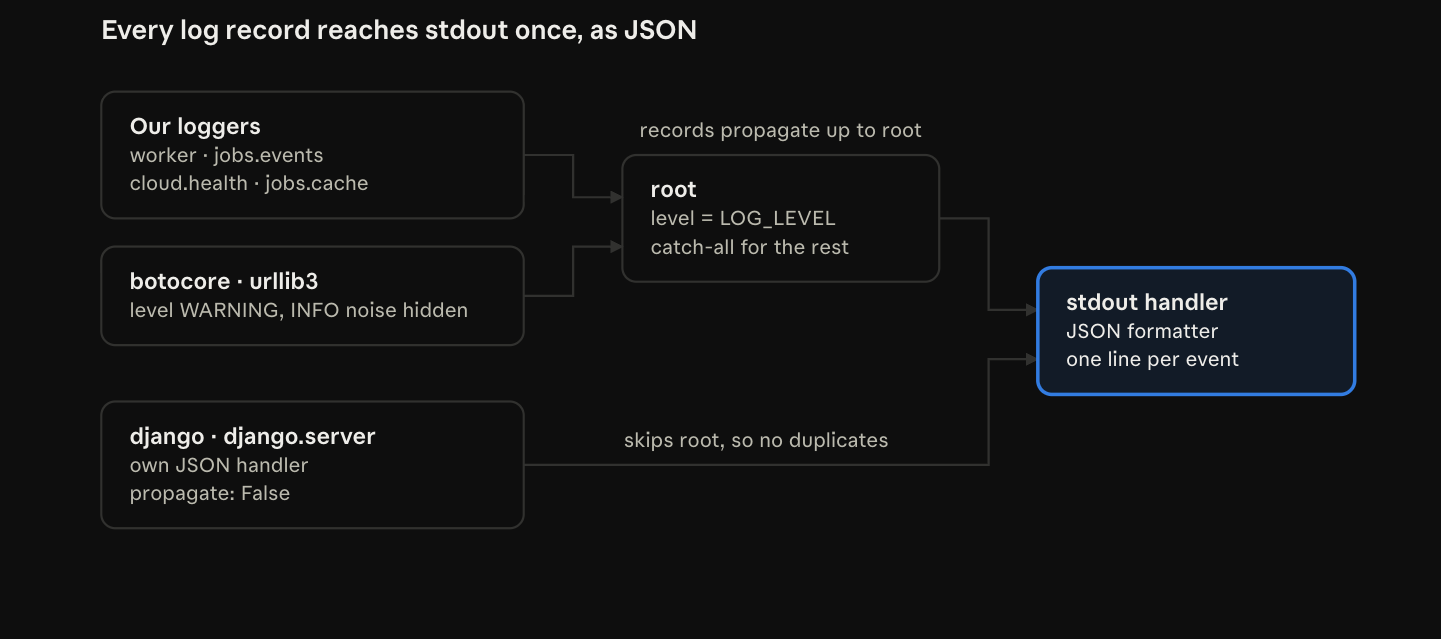
propagate: False is needed because these loggers now have their own handler. If their records also went up to root, root’s handler would print them again, and every line would appear twice. The rule: one handler on each path, no more.
django.server is the request log from runserver, like “GET /api/jobs/ HTTP/1.1” 200 1170. I fixed it at INFO, so setting LOG_LEVEL=WARNING doesn’t hide requests while I develop. Later, gunicorn will have its own access log.
botocore and urllib3 at WARNING: these libraries are noisy at INFO. For example, the worker logged Found credentials in environment variables every time it started. They have no handler of their own, so their warnings and errors still travel up to root and come out as JSON.
Here is the whole picture. Every record has exactly one path to the JSON handler: my loggers and the libraries go through root, and Django’s loggers go straight to it.
One config for both processes
The worker had its own logging.basicConfig(…) call. That’s where lines like 2026-11-06 00:41:06,148 INFO worker … came from. With two places deciding the format, whichever runs last wins, and that’s hard to reason about.
So I removed it. Now the worker’s django.setup() applies the same LOGGING as the API. I checked: grep -n “basicConfig” finds nothing, and the worker’s first line is now:
{"level": "INFO", "logger": "worker", "message": "Worker started, ..."}Real fields, not only sentences
JSON lines are nice, but the real value is adding my own facts as fields. Python’s logging has a way to do that: the extra argument. Here is the API’s publish in jobs/events.py:
            logger.info(
                "Queued %s for application %s (message %s)",
                STATUS_CHANGED,
                application.id,
                message_id,
                extra={
                    "event": STATUS_CHANGED,
                    "event_id": body["event_id"],
                    "application_id": application.id,
                    "message_id": message_id,
                },
            )
The message stays human-readable. It’s what I read in docker compose logs.
Each key in extra becomes an attribute on the log record. It isn’t reserved, so the formatter writes it as a JSON field. The real output had “event”: “application.status_changed”, “event_id”: “9c6d422a-…”, “application_id”: 3 and “message_id”: “afc12ed7-….”.
Types survive. application_id is 3, a number, not “3”. Loki and other tools can compare it as a number.
The order of arguments matters. First the message template, then the values for its %s placeholders, then keyword arguments like extra=. Python requires keyword arguments after positional ones. Anything else is a SyntaxError.
Why its message_id and not message
I couldn’t call the field message. Some names already belong to the log record itself: message, msg, args, name, levelname, module, lineno and others. If an extra key reuses one of them, Python raises:
KeyError: Attempt to overwrite 'message' in LogRecordSo the SQS message ID is message_id.
The failure path gets the same fields
            logger.exception(
                "Could not queue %s for application %s",
                STATUS_CHANGED,
                application.id,
                extra={
                    "event": STATUS_CHANGED,
                    "event_id": body["event_id"],
                    "application_id": application.id,
                },
            )
There’s no message_id here, because there isn’t one when sending failed. Now “show me every failed publish for application 3” is a simple field query.
logger.exception is the same as logger.error with exc_info=True. So the whole traceback lands in one exc_info field. A traceback is one event, not 40 lines that a log system would store as 40 separate events.
The worker’s lines
The idempotency skip from Part 12 now carries the event ID as a field:
            logger.info(
                "Event %s already processed; skipping duplicate",
                body["event_id"],
                extra={"event": STATUS_CHANGED, "event_id": body["event_id"]},
            )
So “was event X delivered twice?” can be answered by counting lines with that event_id.
When an application was deleted before the worker got to it, the application_id comes from the message body, because the application doesn’t exist anymore:
            logger.warning(
                "Application %s no longer exists; skipping (event %s)",
                body["application_id"],
                body["event_id"],
                extra={
                    "event": STATUS_CHANGED,
                    "event_id": body["event_id"],
                    "application_id": body["application_id"],
                },
            )
And the success line carries everything needed to answer “what happened?” without reading the sentence:
    logger.info(
        "Emailed user %s about application %s: %s -> %s (event %s)",
        application.candidate.user_id,
        application.id,
        body["old_status"],
        body["new_status"],
        body["event_id"],
        extra={
            "event": STATUS_CHANGED,
            "event_id": body["event_id"],
            "application_id": application.id,
            "user_id": application.candidate.user_id,
            "old_status": body["old_status"],
            "new_status": body["new_status"],
        },
    )
user_id, not the email address or the name. Logs end up in many more places than the database: Loki, backups, screenshots, support tickets. An ID is enough for someone with database access to look the person up. I don’t log the email body either. This is called data minimization.
application.candidate.user_id reads the foreign key column directly, so there’s no extra query to load the User.
In the worker’s main loop, the two error paths get the SQS message ID:
            except Exception:
                logger.exception(
                    "Failed to handle message %s; it will be retried",
                    message.id,
                    extra={"message_id": message.id},
                )
                continue
            try:
                queue.delete(message)
            except (BotoCoreError, ClientError):
                logger.exception(
                    "Could not delete message %s; it will be redelivered",
                    message.id,
                    extra={"message_id": message.id},
                )
message.id appears twice on purpose. The first one fills the %s in the sentence. The one in extra becomes a separate field. And because the SQS message ID is the same one the API logged as message_id, a failure here links back to the publish.
Correlation: one ID across two processes
Before this step, only the worker logged event_id. To connect the API’s “queued” line to the worker’s “emailed” line, I had to guess from the timestamps.
Now both lines have the same event_id. I can take the ID from the API’s line and filter the worker’s lines by that field, not by searching text. One ID links “queued by the API” to “emailed by the worker”.
This is called correlation, and it’s the basic idea behind distributed tracing. In my next project, OpenTelemetry will do this automatically with trace IDs. Doing it by hand first helped me understand what tracing really solves.
How I tested it
No mocks. Real requests, a real queue, and real logs. And one strict rule: a line only counts as JSON if json.loads can parse it. “Looks like JSON” is not enough.
- Everything is JSON. I parsed every API log line from the last 30 seconds. Result: 7 JSON lines, 0 other.
- The request log uses my handler. The last django.server line had level, logger, message (“GET /api/jobs/ HTTP/1.1” 200 1170), server_time, status_code: 200 and timestamp.
- The invisible INFO lines are back. After a status change, the API logged Queued application.status_changed for application 3 (message f6491adb-…) at 14.685, and the worker logged Emailed … interview -> reviewing at 14.752. That Queued line had been invisible since Phase 3.
- A traceback is one event. I stopped Redis and ran the readiness check. The last cloud.health line was a WARNING, Readiness check cache failed, with one exc_info string holding the whole chained traceback (gaierror → ConnectionError).
- The level comes from the environment. The root level was INFO by default, and WARNING with -e LOG_LEVEL=warning. Lowercase works.
- One config for both processes. grep basicConfig found nothing, and the worker’s start line was JSON.
- The socket is gone. After the reserved_attrs fix, the request line had no request field, but status_code was still there.
- Fields on both sides. I changed a status from reviewing to interview. The API line had event, event_id 9c6d422a-…, application_id 3 and message_id afc12ed7-…. The worker line had the same event_id, plus application_id 3, user_id 5, old_status reviewing and new_status interview.
- Correlation by field. I took the event_id from the API line and filtered the worker’s lines by that field. It found the matching line: worker INFO reviewing -> interview.
- The one exception. Worker and API lines together: 8 JSON, 14 other. The 14 were the console email (headers and body). More on that below.
- Graceful shutdown still works. I restarted the worker: Received signal 15 at 07:56.135, Worker stopped at 08:14.935 (18.8 seconds later), then Worker started at 08:16.724. It finished its current 20-second long poll and exited cleanly.
These commands check it again at any time:
source scripts/dev-helper.sh; waitapi; login_all
curl -s -o /dev/null $API/jobs/ -H "Authorization: Bearer $SAM"
docker compose logs --no-log-prefix --since 20s api | grep '"django.server"' | tail -n 1 | python3 -m json.tool
# After a REAL status change:
docker compose logs --no-log-prefix --since 30s api    | grep '"jobs.events"' | python3 -m json.tool   # event_id X
docker compose logs --no-log-prefix --since 30s worker | grep "Emailed"        | python3 -m json.tool   # same event_id X
Problems I hit
1. The same 000 as last time
The first three checks returned 000, and getting tokens failed with JSONDecodeError. That’s exactly the startup problem from Part 14: the checks ran while runserver was still starting.
But this time I had a fix for it, my waitapi helper. So why didn’t it help? Because of the order of my commands. waitapi ran before source scripts/dev-helper.sh, the line that defines it. The shell said waitapi: command not found, nothing waited, and the checks ran during the startup gap.
The fix: source first, then waitapi, then the checks. The re-run gave 7 JSON lines, 0 other.
2. My helper wasn’t even saved
While fixing problem 1, I found a second one: waitapi wasn’t in scripts/dev-helper.sh at all. In Part 14 I had planned to append it to the file, but I never ran that command. My m helper only worked because I had typed it into that shell by hand.
I found it with type, which tells you what a command name really is:
type waitapi mIt said waitapi: not found, but m is a function. I checked that the file had no copy of the helpers yet (count 0, so no duplicates), then ran the append with cat >> scripts/dev-helper.sh <<‘EOF’. After that, type showed both as functions.
The lesson: something that works in my current shell may not exist anywhere else. If it isn’t in a file, it isn’t real.
3. A network socket in every request line
The request log had this field:
"request": "<socket.socket fd=4, ... laddr=('172.18.0.6', 8006), ...>"The cause: runserver attaches the socket to its log records as an extra request attribute. The JSON formatter copies every non-reserved attribute, and when it can’t turn an object into JSON, it falls back to str().
The fix was the one I explained above: “reserved_attrs”: [*RESERVED_ATTRS, “request”].
4. 8 JSON lines, 14 other
This one looked like a bug, but it wasn’t. I printed the lines that weren’t JSON, and all 14 were the console email: its headers and body. Django’s console email backend writes the email directly to the output stream, not through logging, so my formatter never sees it.
That’s fine. The console backend is for development only, and seeing the email locally is the whole point of it. I accepted it and wrote it down as a known exception.
Why I chose this way
- python-json-logger instead of structlog. It’s small and plugs into standard logging, so I didn’t have to change any logger.info calls. structlog is more powerful (it can bind context to a logger), but it means a different API everywhere. A hand-written formatter would be more code to maintain.
- Human sentences plus extra fields. Readable in docker compose logs, and queryable in Loki. Fields only would be hard to read locally.
- UTC ISO timestamp instead of asctime. It includes the timezone and sorts correctly.
- stdout and one handler. That’s the container convention. Files are lost with the container and can fill the disk.
- django.server fixed at INFO. I still see requests locally when LOG_LEVEL=WARNING.
- IDs, not emails or names. Personal data shouldn’t be copied into every log system.
- The console email stays plain text. Building a JSON email backend for a development-only tool isn’t worth it.
Known gaps
- The console email backend prints the whole email (address and body) as plain text. It’s development only, with fake addresses. In production, EMAIL_BACKEND is a real mail service and nothing is printed.
- runserver’s startup banner is plain text (Watching for file changes, Starting development server). It goes away when I switch to gunicorn, but then gunicorn’s own logs will need configuring too.
- API request lines have no request ID yet. event_id only covers the status-change flow. A per-request ID (a middleware and a header) or OpenTelemetry trace IDs come in my next project.
- Changing LOG_LEVEL needs a restart.
What I learned
- Structured logs are fields, not sentences. And the values keep their types: 3 stays a number.
- One event, one line. A traceback belongs inside a field, not spread over 40 lines.
- Logs go to stdout. The platform collects them; the app shouldn’t manage files.
- dictConfig has a clear structure: formatters (the look), handlers (the destination), loggers (which records), and root (the catch-all).
- Propagation is powerful but easy to get wrong. Records go up to root unless propagate: False. One handler per path, or every line prints twice.
- logging.lastResort only prints WARNING and above. That one fact explained a mystery I’d had since Part 10.
- extra keys can’t reuse log record names, like message.
- One shared ID across processes is correlation, the first step toward tracing.
- Log IDs, not personal data.
What comes next
Next is configuration from environment variables only, so the same image runs anywhere. After that, a multi-stage Dockerfile with gunicorn instead of runserver. That’s also where I have to solve the gunicorn problems I wrote down in this part and the last one: split metrics counters and the startup banner.
Later, in my next project, these JSON logs go to Loki, and I’ll query their fields with LogQL, like this:
{container="api"} | json | level="WARNING"